
The Problem
Your Dashboards Lie to You
Traditional APM tells you your service is healthy. Response time: 230ms. Error rate: 0.2%. Everything green. Meanwhile your chatbot just confidently gave a user the wrong answer, your retrieval pipeline silently degraded after a schema change last Tuesday, and a prompt variant from two sprints ago is still somehow running in production. You have no idea.
LLMs Break What Distributed Tracing Was Built For
This is the observability gap specific to LLM applications — and it's different from anything distributed tracing was designed to solve. Jaeger and Zipkin tell you where latency lives in your system. They don't tell you what the model was asked, what context it was given, whether the retrieval step returned semantically relevant chunks, or why the output drifted from what you intended. The non-determinism of language models means you can't reproduce failures from a stack trace. The inputs matter. The exact prompt matters. The retrieved context matters. All of it needs to be captured, structured, and queryable.
This is observability for a single LLM application. It is distinct from agent observability, which traces multi-step agent trajectories — tool calls, sub-agents, and reasoning steps — across the OpenTelemetry GenAI conventions. The two layers are complements: one watches the generation, the other watches the trajectory.
The Failure Mode Is Silent Degradation
The failure mode isn't a crash — it's silent degradation. A model update degrades response quality for a specific user segment. A prompt change introduces subtle hallucination patterns at low frequency. Over-retrieval inflates token costs 40% across a document class nobody flagged. These don't show up in existing dashboards. They accumulate in production until a user escalates or an audit surfaces them — long after the window for clean root cause analysis has closed.
How LLM Observability Actually Works
Traces and Observations: The Core Primitives
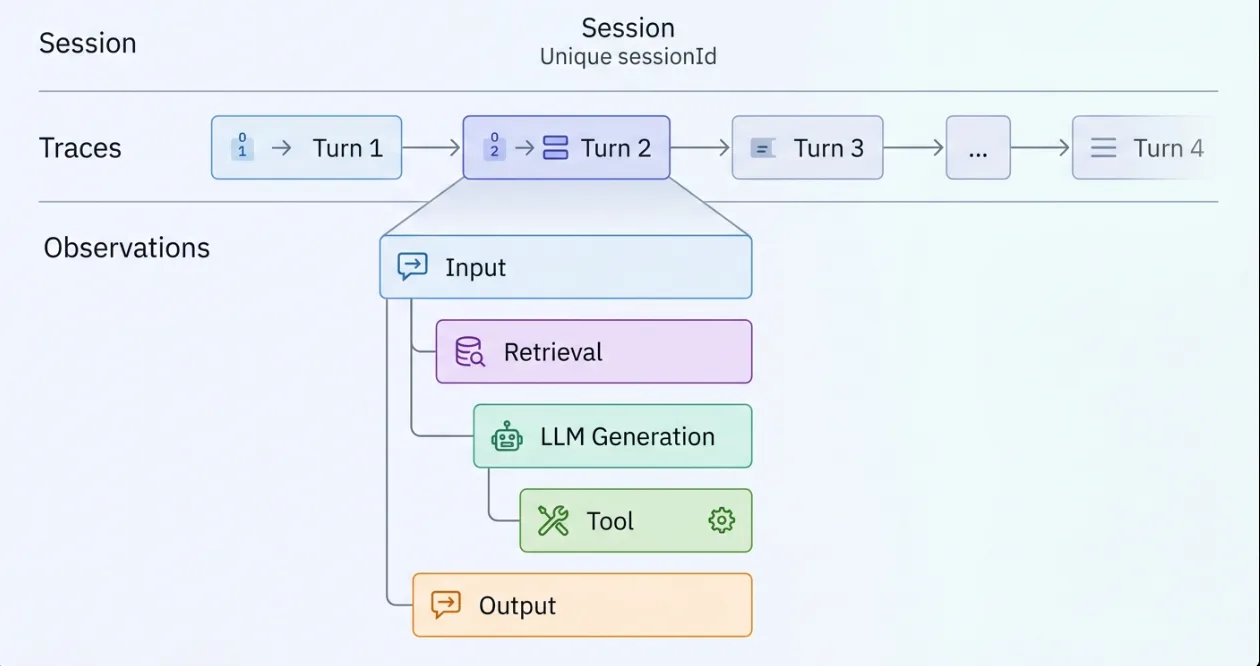
The core primitive is a trace — a structured, hierarchical record of one complete unit of work. For a chatbot, that's one turn: user message in, assistant response out. Inside that trace, every operation is an observation: the retrieval call, the re-ranking step, each LLM invocation, any tool execution. Observations nest to preserve causality — you can see exactly which context was retrieved before which model call produced which output.
Typed Observations: Why the Distinction Matters
What separates LLM-specific observability from generic tracing is typed observations. LLM calls must be marked as generation observations, carrying the model name, input/output token counts, and optional cached token data. Without this, cost tracking doesn't work and you can't build token-level analytics. Tool calls get their own tool type, enabling filtering by tool in evaluation pipelines. Framework internals — HTTP client spans, ORM queries — are filtered out. A clean trace tree contains only observations meaningful to an engineer debugging AI behavior, not infrastructure behavior.
| Observation type | What it captures | Attributes it must carry | What breaks if the type is wrong |
|---|---|---|---|
generation | One LLM invocation | Model name, input and output token counts, optional cached-token data | Cost tracking and token-level analytics stop working entirely |
tool | An external call — retrieval, search, tool execution | Enough identity to tell one tool from another | Evaluation pipelines lose the ability to filter or score by tool |
| Nested spans | The ordering of operations inside a single turn | Parent-child nesting under the trace | Causality is lost — you can no longer see which context was retrieved before which model call produced which output |
| Framework internals | HTTP client spans, ORM queries | Nothing; these should be stripped from the tree | The trace tree fills with infrastructure noise instead of AI behavior |
Sessions: Grouping Multi-Turn Conversations
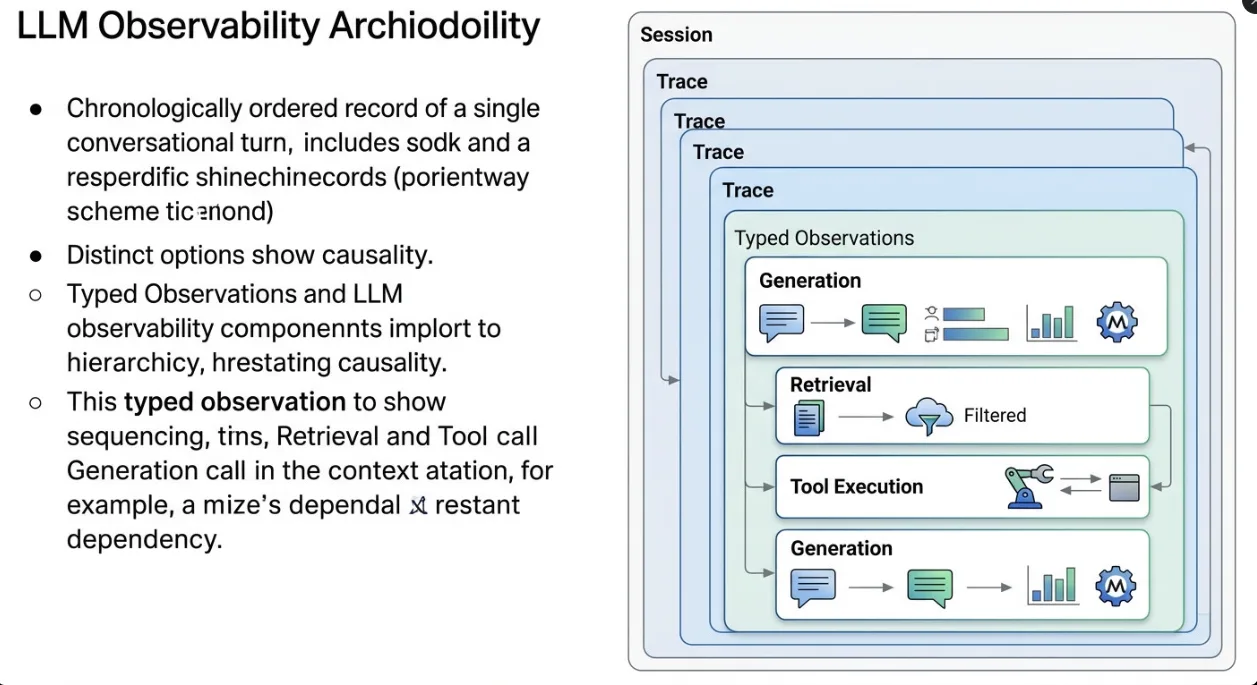
Sessions handle the multi-turn case. A sessionId propagates across every turn of a conversation, grouping related traces into a unified chronological view. Session replay lets you walk through an entire interaction end-to-end. Context propagation utilities inherit the session ID across nested observations automatically — no manual threading through every call frame.
The Data Architecture Behind It
The data architecture underneath matters at scale. A few principles to get right from the start:
- Separate transactional writes from analytical reads. Trace ingestion and dashboard queries have very different access patterns — mixing them on the same store creates contention as volume grows.
- Buffer ingest from storage writes. Raw events should land in a durable queue or blob layer before being committed to your query store. This keeps the ingest path resilient to traffic spikes and prevents write pressure from affecting read latency.
- Cache aggressively on hot paths. API key validation and prompt retrieval happen on every request — an in-memory caching layer in front of your primary store is essential to keep per-request overhead negligible.
- Use asynchronous SDKs. Trace events should queue locally and flush in batches in the background. Synchronous instrumentation that blocks the request path defeats the purpose — observability must be invisible to end-user latency.
Instrumentation Budgets: The Numbers Your SDK Already Enforces
"Capture everything" is a plan right up until the first production week, when the trace store is the second-largest line on the cloud bill and half the spans are quietly truncated. Before designing a schema, know the ceilings you are already running under. These are the OpenTelemetry SDK defaults, fixed by the specification's environment-variable configuration and applied by every conformant language SDK unless you override them [6].
| Knob | Default | What it costs you silently |
|---|---|---|
OTEL_SPAN_ATTRIBUTE_COUNT_LIMIT | 128 | Attribute 129 on a span is dropped, not errored |
OTEL_SPAN_EVENT_COUNT_LIMIT | 128 | Per-step events past 128 vanish from the trace |
OTEL_SPAN_LINK_COUNT_LIMIT | 128 | Caps how many other traces one span can point at |
OTEL_ATTRIBUTE_COUNT_LIMIT | 128 | The general, non-span attribute ceiling |
OTEL_SPAN_ATTRIBUTE_VALUE_LENGTH_LIMIT | no limit | A whole prompt, or a 200 KB retrieved chunk, goes on the wire intact |
OTEL_BSP_MAX_QUEUE_SIZE | 2048 | Spans buffered locally before the exporter starts dropping |
OTEL_BSP_MAX_EXPORT_BATCH_SIZE | 512 | Spans per export request |
OTEL_BSP_SCHEDULE_DELAY | 5000 ms | How stale the freshest span in your backend can be |
OTEL_BSP_EXPORT_TIMEOUT | 30000 ms | Ceiling on a single export attempt |
OTEL_TRACES_SAMPLER | parentbased_always_on | You are sampling at 100% until you say otherwise; the ratio-based samplers default their argument to 1.0 |
The row that bites LLM applications specifically is the value-length limit, read against the sampler default. The SDK keeps every trace by default, imposes no bound on attribute value length by default, and a generation observation carries the full prompt, the full retrieved context, and the full completion. That is a per-turn payload far larger than the APM span the same defaults were written for, arriving at 100% of traffic, batched 512 at a time.
What good looks like here is a split policy rather than one sampling rate: keep the span skeleton — timings, model name, token counts, prompt version — on every turn, because that is what your cost and latency dashboards aggregate and it is small; sample the bodies (prompt, context, completion) at whatever rate your retention budget affords, and set an explicit value-length limit so one pathological document cannot become one pathological export. Reach for head sampling of whole traces last, because a sampled-away trace is exactly the one someone will ask you to produce.
One more number to plan around: OpenTelemetry's GenAI semantic conventions are still marked Development — not stable — and only two span attributes are Required, gen_ai.operation.name and gen_ai.provider.name [7]. Everything else you will build dashboards on, token counts included, sits at Conditionally Required, Recommended, or Opt-In. Treat conformance as a floor you extend rather than a schema you inherit, and pin the convention version you built against, because the shape is explicitly not frozen yet.
Evaluation as an Engineering Discipline
Why Traces Alone Aren't Enough
Capturing traces is necessary but not sufficient. The harder engineering problem is turning raw trace data into a continuous quality signal — at production scale, without human review of every conversation.
LLM-as-a-Judge: Automated Scoring at Scale
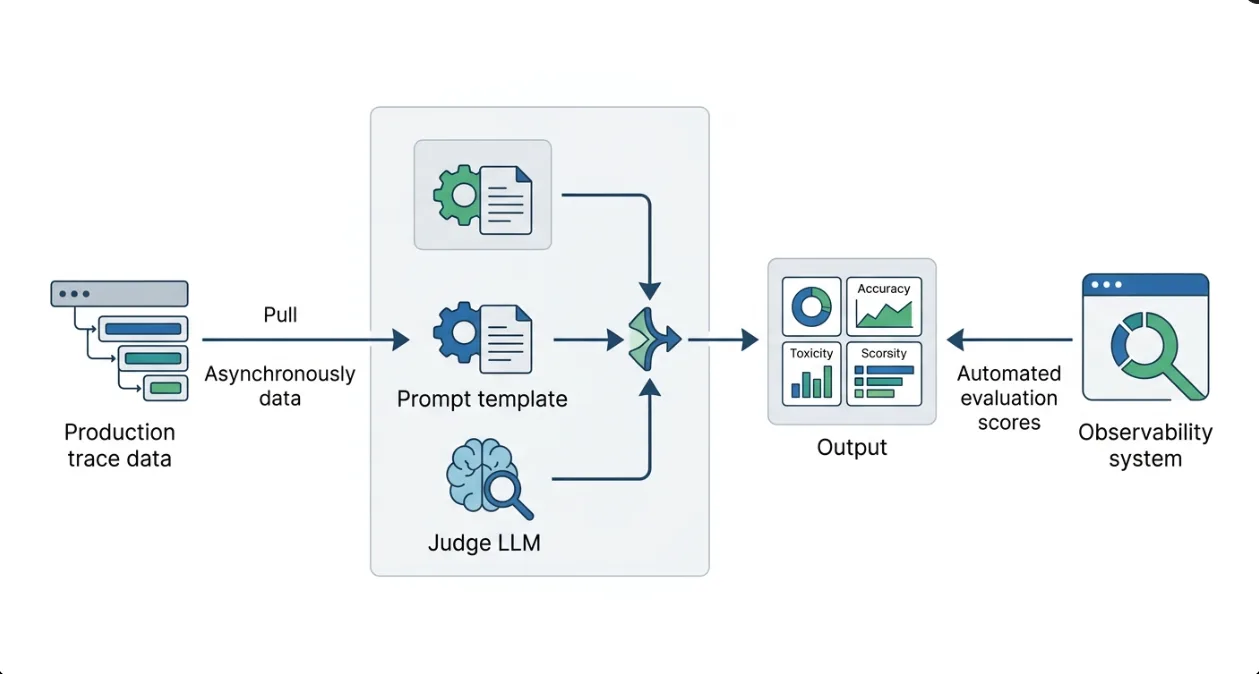
LLM-as-a-judge is the production-scale answer. You configure an evaluator with three things: the judge model (must support structured output), a prompt template with {{variables}} mapped to JSONPath expressions over the trace data, and scoring criteria. Evaluators run asynchronously against observation-level targets — completing in seconds, processing thousands of traces per minute. Score types are typed: numeric (0–1 scale for dimensions like helpfulness), categorical (discrete labels), boolean (binary policy checks). Every evaluator run generates its own trace in an isolated environment (langfuse-llm-as-a-judge), so your evaluation pipeline is observable the same way your application is.
The Dev-to-Production Evaluation Pattern
The pattern that works: use Experiments against curated datasets during development to validate prompt changes before deploy. Switch to observation-level evaluators in production for continuous monitoring. When a quality metric drops, you have the exact traces that caused it — filterable, queryable, linked back to the specific prompt version and model that produced them. For scoring multi-step agent trajectories and tool calls rather than single generations, see our guide to evaluating agent trajectories.
Human Annotation: One Unified Scoring Layer
Human annotation queues handle what automated scoring misses: high-stakes domains, edge cases, anything requiring subject matter expertise. Scores from reviewers land in the same data model as automated scores, queryable through the same APIs. There's no separate evaluation silo — it's one unified scoring layer.
Prompt Versioning as a Production Concern
Prompts Are Deployable Artifacts
Prompt management is a deployment problem, not a configuration problem. Every prompt reaching a model in production should be versioned and linked to the generation it produced. This is the only way to answer the question engineers actually need: "did this prompt change improve or hurt quality on real traffic?"
How Version-Linked Tracing Works
The mechanics: a prompt library stores named prompts with labeled versions — production, staging, or arbitrary environment labels. Runtime retrieval with caching keeps latency overhead negligible. When a generation is created, the prompt version attaches as an attribute. Now you can filter your entire trace history by prompt version, compare score distributions between versions, and measure cost per version against production data — not synthetic benchmarks. The full pattern — registry, labels, and version-linked tracing — is in our prompt versioning guide.
Rollback Is a Label Change
Version rollback is a label change. No redeployment. No config propagation. The application pulls production on its next request and gets the previous version's prompts immediately.
Building the Stack
Instrument at the turn boundary. One chatbot turn = one trace. Wrap the turn handler, not individual model calls. Most major frameworks — LangChain, LlamaIndex, OpenAI Agents, PydanticAI — have native integrations. Use them rather than building manual instrumentation.
Type your observations correctly. Every LLM call needs to be a
generationwith model name and token counts. Every external call (retrieval, search, tool execution) is atool. Strip framework internals from the trace tree — they're noise, not signal.Propagate session and user context. Use the SDK's context propagation utilities. Attach
userId,sessionId,environment, and relevant metadata at trace creation. These become your primary filter dimensions at 3am during an incident.Wire up prompt versioning before you need it. Connect your prompt library to your trace data and attach the version reference to each generation. This is the prerequisite for any meaningful evaluation of prompt changes — and much harder to retrofit than to build in from the start.
Deploy evaluation incrementally. Start with one LLM-as-a-judge evaluator on your highest-traffic observation type. Use the live preview to validate the prompt against real historical data before it runs in production. Expand coverage as you calibrate which scoring dimensions actually track quality for your use case.
Query programmatically. The trace data isn't just for dashboards. Use the observability APIs to feed evaluation pipelines, construct training datasets, automate cost attribution, and build custom analytics. New data is queryable within seconds of ingestion; use bulk export for large-scale historical pulls.
Plan data residency from day one. Regulated environments and sensitive workloads require keeping trace data within a VPC. Self-hosting on Kubernetes or cloud infrastructure gives you full control over encryption, data masking, network policy, and SSO.
Own the AI Product, Not the Observability Infrastructure
Building this stack correctly takes engineering cycles that compete with shipping the actual product. Instrumentation is tractable. The hard part is everything around it: cost attribution pipelines, prompt version management, evaluation workflows, session analytics, audit storage, and the operational overhead of keeping it all running. Teams that build it themselves often end up maintaining observability infrastructure instead of improving the chatbot.
The real question for a technical leader isn't whether you can build this — it's whether observability is your product or your plumbing.
Frequently Asked Questions
What is LLM observability?
LLM observability is the practice of capturing every input, retrieved context, model call, and output of an LLM application as structured, queryable trace data — so non-deterministic behavior becomes debuggable after the fact. Unlike traditional APM, which reports latency and error rates, LLM observability records what the model was asked, what context it was given, and why the output drifted, making silent quality degradation visible before users escalate.
How is LLM observability different from traditional APM?
APM tools like Jaeger and Zipkin were built to locate latency in distributed systems. They cannot reproduce an LLM failure from a stack trace because the failure lives in the inputs — the exact prompt, the retrieved chunks, the model version. LLM observability captures those inputs as typed observations (generation, tool, retrieval) inside a per-turn trace, plus token counts and prompt versions APM never models.
What is LLM tracing?
LLM tracing records one complete unit of work — for a chatbot, one turn — as a hierarchical trace, with each operation (retrieval, re-ranking, model call, tool execution) captured as a nested observation. The nesting preserves causality: you can see exactly which context was retrieved before which model call produced which answer.
What is LLM-as-a-judge?
LLM-as-a-judge is a production-scale evaluation method that uses a judge model with structured output, a prompt template mapped to trace data, and explicit scoring criteria to score generations automatically — numeric, categorical, or boolean. It runs asynchronously against observation-level targets, scoring thousands of traces per minute without human review of every conversation.
Do I need prompt versioning?
Yes, if you ship prompt changes to production. Prompt versioning treats every prompt as a deployable artifact linked to the generation it produced, so you can answer "did this change improve or hurt quality on real traffic?" Rollback becomes a label change — the application pulls the production label on its next request — with no redeployment.
Can I self-host LLM observability for regulated data?
Yes. Regulated and sensitive workloads can keep trace data inside a VPC by self-hosting the observability stack on Kubernetes or cloud infrastructure, retaining full control over encryption, data masking, network policy, and SSO — the same pattern enterprises apply to other production AI systems.
References
- OpenTelemetry — Semantic Conventions for Generative AI systems. https://opentelemetry.io/docs/specs/semconv/gen-ai/
- W3C — Trace Context (the standard that propagates trace and span identity across services). https://www.w3.org/TR/trace-context/
- Langfuse — Open-source LLM engineering platform: tracing, evaluation, and prompt management. https://langfuse.com/docs
- Zheng et al., "Judging LLM-as-a-Judge with MT-Bench and Chatbot Arena." https://arxiv.org/abs/2306.05685
- Ragas — Evaluation framework for retrieval-augmented generation pipelines. https://github.com/explodinggradients/ragas
- Source of the SDK default limits quoted above — 128 attributes, events and links per span, no default attribute-value length limit, batch processor defaults of 2048 queued / 512 per export / 5000 ms delay / 30000 ms timeout, and
parentbased_always_onas the default sampler — OpenTelemetry SDK environment-variable specification (2026): https://opentelemetry.io/docs/specs/otel/configuration/sdk-environment-variables/ - Establishes that the GenAI span conventions are still at Development (not stable) status and that only
gen_ai.operation.nameandgen_ai.provider.nameare Required — OpenTelemetry GenAI semantic conventions (2026): https://github.com/open-telemetry/semantic-conventions-genai/blob/main/docs/gen-ai/gen-ai-spans.md